Top Chart Libraries for Modern Web Apps in January 2026
Compare Chart.js, D3.js, Recharts, Highcharts, Nivo, and Victory for modern web apps. Learn SVG vs Canvas rendering, React integration, and performance tips.
You need to add charts to your app, so you're looking at charts libraries for React, Vue, or vanilla JS. The challenge is that some libraries are built for speed and simplicity, while others are built for flexibility and control. If you pick the wrong one, you'll either spend days fighting with customization or end up rebuilding everything when your requirements change. This guide covers the top charting libraries in 2026 and helps you figure out which one fits your project.
TLDR:
- Chart.js handles 2M+ weekly downloads for quick implementations; D3.js gives pixel-level control for custom visualizations
- Canvas rendering outperforms SVG when displaying 1,000+ data points but pixelates on zoom; SVG stays crisp at any scale
- Most libraries slow down between 1,000-5,000 data points; switch to Canvas or aggregate data into bins to maintain performance
- Recharts and Victory work only with React; Chart.js ships official wrappers for Angular, Vue, and React
- Velt adds real-time commenting and collaboration to analytics dashboards built with any charting library
Understanding JavaScript Charting Libraries
Building charts from scratch with raw SVG or Canvas APIs requires hundreds of lines of code just to create axes, legends, tooltips, and responsive resizing. JavaScript charting libraries, though, handle this complexity by providing pre-built components that render interactive visualizations with less effort. These libraries manage the mathematical calculations for scaling data to pixel coordinates, handle cross-browser inconsistencies, and provide accessibility features. They let you focus on interpreting your data instead of rendering it.
The right charting library depends on your requirements. Some favor quick implementation, while others offer deep customization for complex use cases. Framework compatibility matters, since libraries built for React or Vue integrate more naturally than framework-agnostic options. And, performance becomes critical when visualizing large datasets or updating charts in real time. Some libraries render thousands of data points smoothly, while others struggle with scale.
SVG vs Canvas Rendering Approaches
JavaScript charting libraries use either SVG or Canvas rendering engines, and this choice affects how your charts perform:
- Canvas draws pixels directly to a bitmap, making it faster when rendering thousands of data points or elements. The tradeoff is higher memory consumption on mobile devices and pixelation when users zoom in.
- SVG renders each chart element as a DOM node, which uses less memory and stays crisp at any zoom level. This approach works well for simpler charts but slows down when visualizing large datasets with many individual elements.
Some libraries like Apache ECharts let you switch between renderers depending on your data size.
Chart.js for Beginner-Friendly Implementations
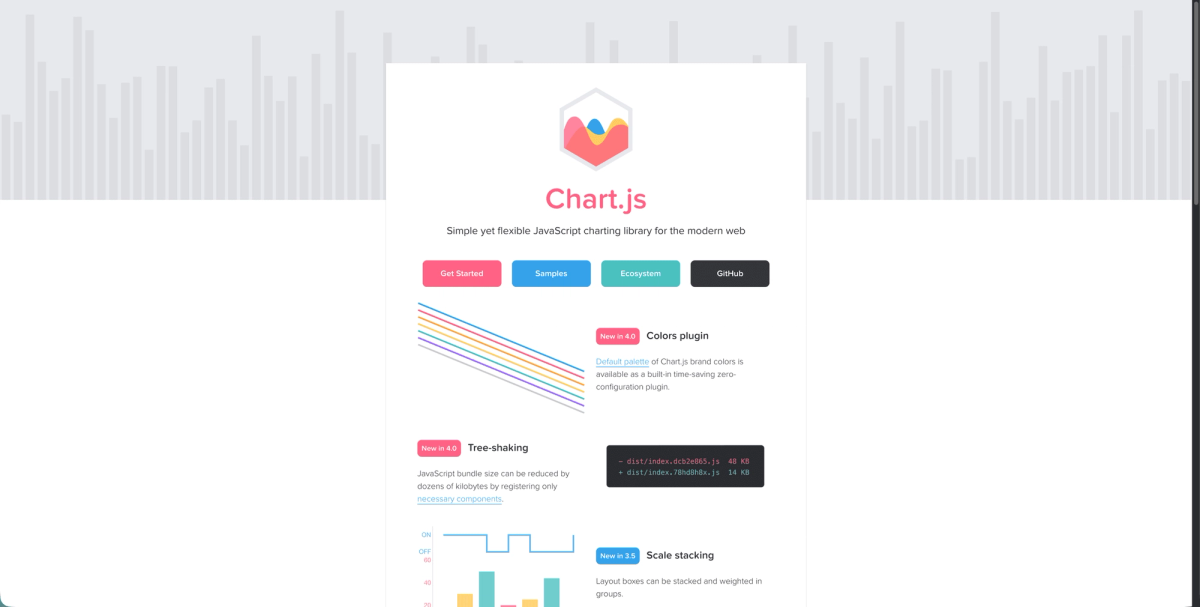
Chart.js has become the default choice for developers implementing their first data visualizations, with over two million weekly downloads. The library ships with eight standard chart types including line, bar, pie, and radar, covering most common visualization needs.
The API design favors simplicity. You configure charts using plain JavaScript objects instead of learning complex methods or chaining patterns. This declarative approach lets you create a functional bar chart with minimal configuration.
Chart.js handles responsive behavior automatically, resizing charts when viewport dimensions change. Built-in animations make transitions smooth when data updates, and the tooltip system works out of the box without additional setup. The library supports all major frameworks through official wrappers for React, Vue, and Angular. These adapters handle lifecycle management and reactivity, letting you treat charts as normal framework components.
Customization options exist for colors, fonts, axes, and legends, but advanced visual requirements push against Chart.js's simpler architecture. Teams needing unusual chart types or pixel-perfect control typically outgrow it.
D3.js for Complete Customization Control
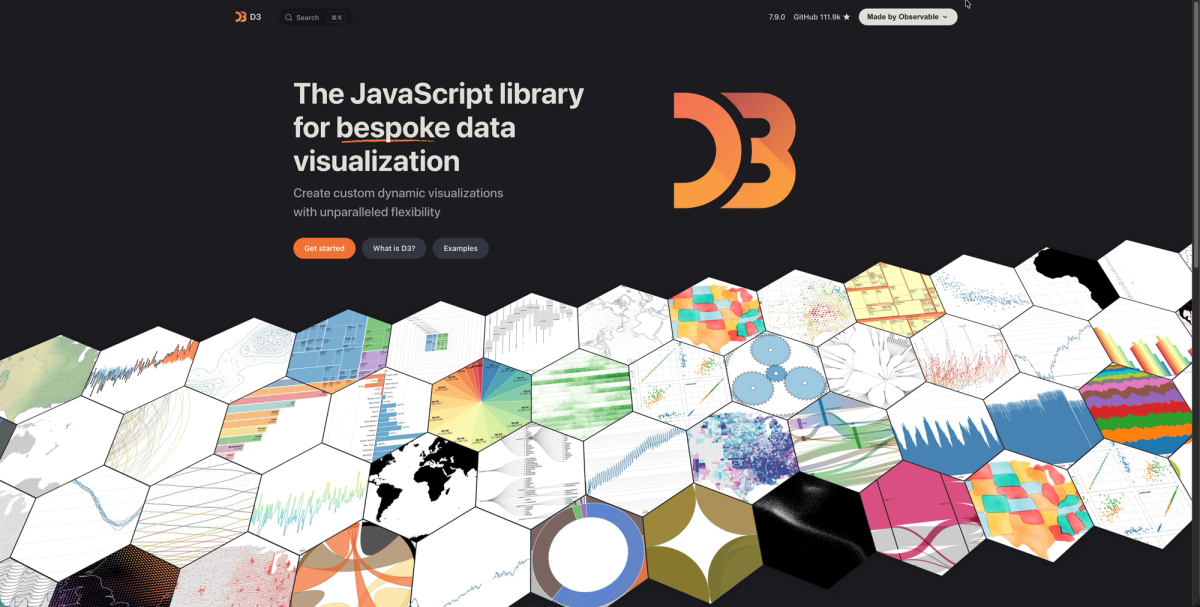
D3.js is a low-level toolkit for binding data to DOM elements and applying transformations. You get complete control over every pixel, animation curve, and interaction behavior. This flexibility, though, requires understanding SVG coordinate systems, data joins, scales, and axis generators before building basic charts. The learning curve is steep compared to higher-level libraries.
D3 works well for visualizations that don't fit standard templates. Custom network diagrams, specialized scientific plots, or interactive infographics with unusual behaviors make sense for the investment. For standard bar and line charts, you're trading development speed for control you likely won't use. Many teams use D3 utilities like scales and axis generators alongside simpler charting libraries for mathematical precision without rebuilding from scratch.
Recharts for React Applications
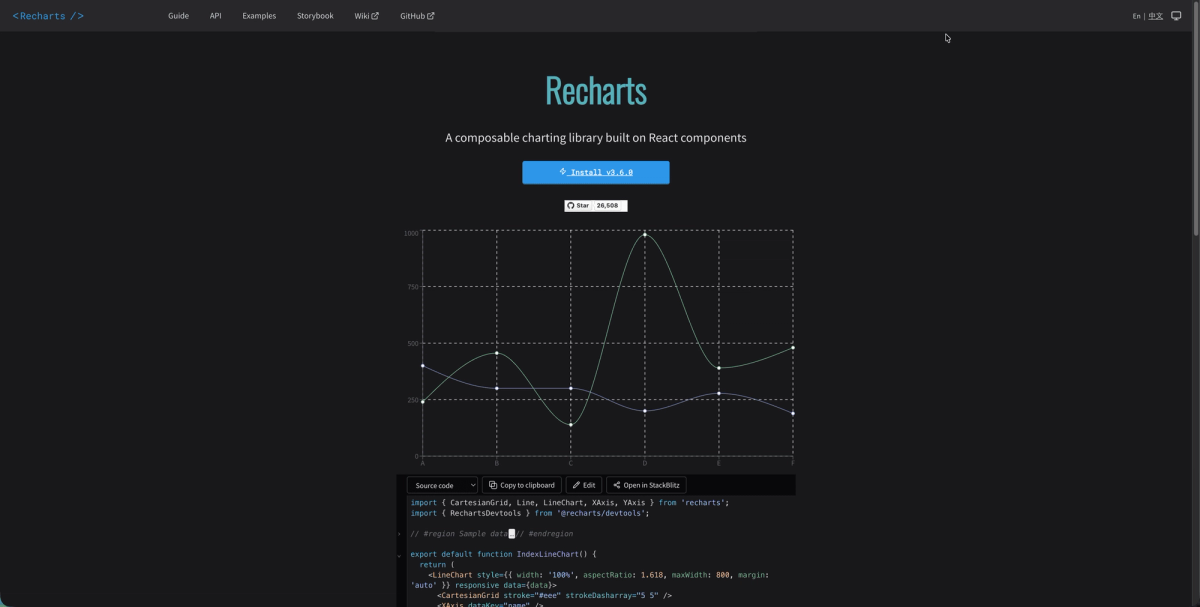
Recharts treats charts as composable React components. You build visualizations using JSX syntax by nesting components like <LineChart>, <XAxis>, and <Tooltip> instead of passing configuration objects. This approach integrates with React state management and hooks. When your data changes, Recharts updates automatically through React's rendering cycle. The library includes responsive containers, animations, and event handlers that work like standard React props.
Chart types cover line, bar, area, scatter, and pie visualizations. Recharts works exclusively with React and offers no benefits if you're using other frameworks.
Highcharts for Enterprise Requirements
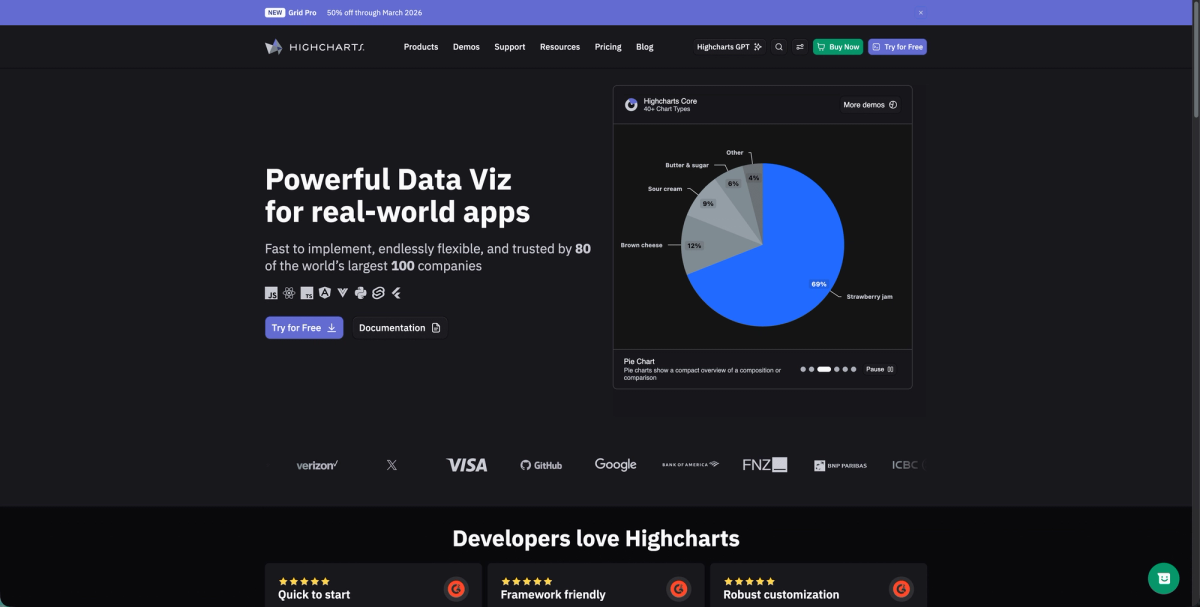
Highcharts operates as a commercial charting library with licensing fees starting at $800 annually per developer. This pricing funds dedicated support teams, extensive documentation, and guaranteed backward compatibility.The library includes over 90 chart types, from basic line graphs to specialized financial indicators, heat maps, and dependency wheels. This breadth removes the need to mix multiple charting solutions across different parts of your app.
Over 50,000 companies use Highcharts across finance, publishing, and data science sectors. The library ships with official wrappers for React, Angular, and Vue, plus export modules for generating PDFs and images server-side. Free licensing exists for non-commercial projects, but commercial apps require paid licenses.
Nivo for React-Based Data Visualization
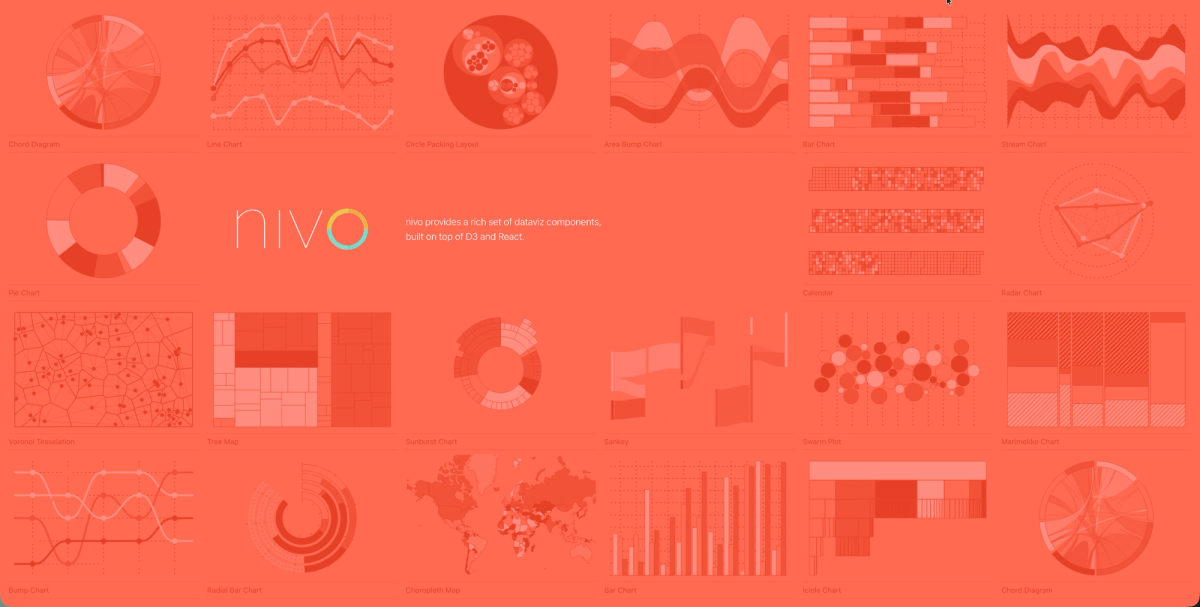
Nivo wraps D3's visualization primitives into React components with polished default styling. The library renders charts server-side for Next.js and Gatsby projects, generating static SVG during build time for faster initial page loads. The component API resembles Recharts but uses D3's mathematical precision under the hood. This gives you accurate scales and transformations without learning D3's selection patterns. Nivo includes motion configurations using React Spring, creating fluid animations when data updates.
The smaller community means fewer Stack Overflow answers and third-party examples compared to Chart.js or D3.
Victory for Cross-Platform Charting
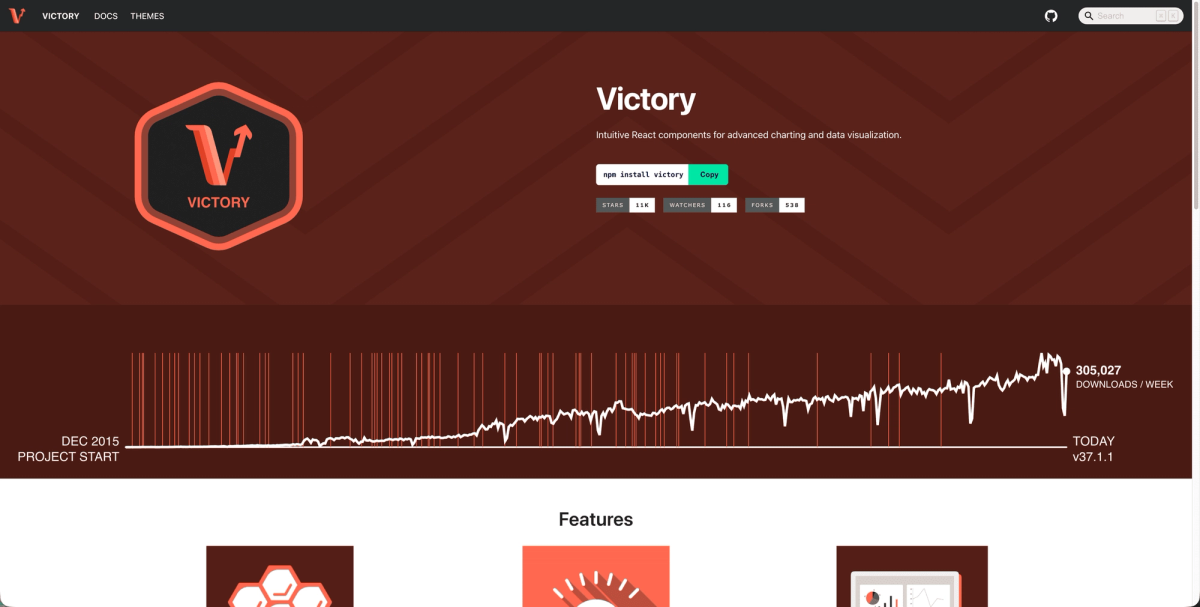
Victory renders charts the same way across web browsers and React Native mobile apps. The library uses a single component API for iOS, Android, and web, removing the need to maintain separate charting code. The library gets 126,898 weekly downloads and supports line, bar, area, and pie charts through composable React components. Victory's components accept identical props and data structures across rendering targets, letting teams share visualization logic between codebases, similar to how rich text editors work across frameworks.
This cross-platform consistency helps when building products that need feature parity between web and mobile. Teams working only on web apps see no benefit from Victory's React Native support and might prefer lighter alternatives like Recharts. Victory includes animation and theming that work across both environments, though the bundle size is larger than web-only libraries.
Side-by-Side Comparison
We've pulled together a quick overview table below to help you more quickly compare the different charting options.
| Library | Best For | Framework Support | Rendering Engine | Weekly Downloads* | Learning Curve | Pricing |
|---|---|---|---|---|---|---|
| Chart.js | Quick implementations with standard chart types | React, Vue, Angular (official wrappers) | Canvas | 6.3M+ | Low - simple configuration objects | Free and open source |
| D3.js | Complete customization control and complex visualizations | Framework-agnostic (requires custom wrappers) | SVG | 6.3M | Steep - requires understanding SVG, data joins, scales | Free and open source |
| Recharts | React applications with composable components | React only (JSX composition) | SVG | 11M+ | Low to Medium - React component patterns | Free and open source |
| Highcharts | Enterprise requirements with extensive chart types | React, Angular, Vue (official wrappers) | SVG/Canvas hybrid | 1.3M | Medium - comprehensive documentation | $800+ annually per developer (free for non-commercial) |
| Nivo | React-based projects with server-side rendering | React only (Next.js, Gatsby compatible) | SVG (D3-powered) | 800k | Medium - D3 precision with React API | Free and open source |
| Victory | Cross-platform web and React Native mobile apps | React and React Native | SVG | 270K | Medium - unified component API | Free and open source |
| Apache ECharts | Large datasets requiring flexible rendering options | Framework-agnostic | SVG and Canvas (switchable) | 1.1M+ | Medium - extensive configuration options | Free and open source |
*based on 2025 year-end downloads as provided through npm.
Framework Integration Considerations
As you are considering a charting option for your application, it's important to understand the framework support to make sure that you are getting the chart library that works best for your app:
- Chart.js ships with official wrappers for Angular, Vue, and React, handling component lifecycle and reactivity automatically across all three frameworks.
- Recharts and Nivo work only with React through JSX composition, treating charts as native React components that accept data via props and hooks.
- For Angular projects, Chart.js provides TypeScript definitions and RxJS compatibility out of the box. D3.js needs custom wrapper components to work with Angular's change detection.
- Vue developers can mount most charting libraries using standard patterns. Vue-chartjs removes boilerplate by managing data watching and re-renders.
Performance Optimization for Large Datasets
Are you trying to chart against large datasets? If that's the case, your chart library choice will play a big part in how performant the charting functions in your app are. Consider the following when assessing chart libraries. Regardless of your library choice, a best practice to improve performance is to debounce resize events to prevent excessive re-renders when users adjust their browser window.
- Most charting libraries slow down around 1,000 to 5,000 data points, causing laggy interactions and choppy animations.
- Apache ECharts handles large datasets by letting you switch rendering engines based on data size. Use Canvas rendering when displaying more than 1,000 elements, and switch to SVG for smaller datasets where crisp scaling matters.
- Data aggregation prevents performance issues before they start. Instead of plotting 50,000 individual points, bin them into 500 averaged groups when users zoom out. Plotly.js includes built-in data sampling that automatically reduces point density while preserving visual trends.
- Chart.js struggles with datasets exceeding 10,000 points since it recalculates layouts on every render. D3.js performs better at scale but requires manual optimization like quadtree spatial indexing for interactive features.
Adding Real-Time Collaboration to Data Visualizations with Velt
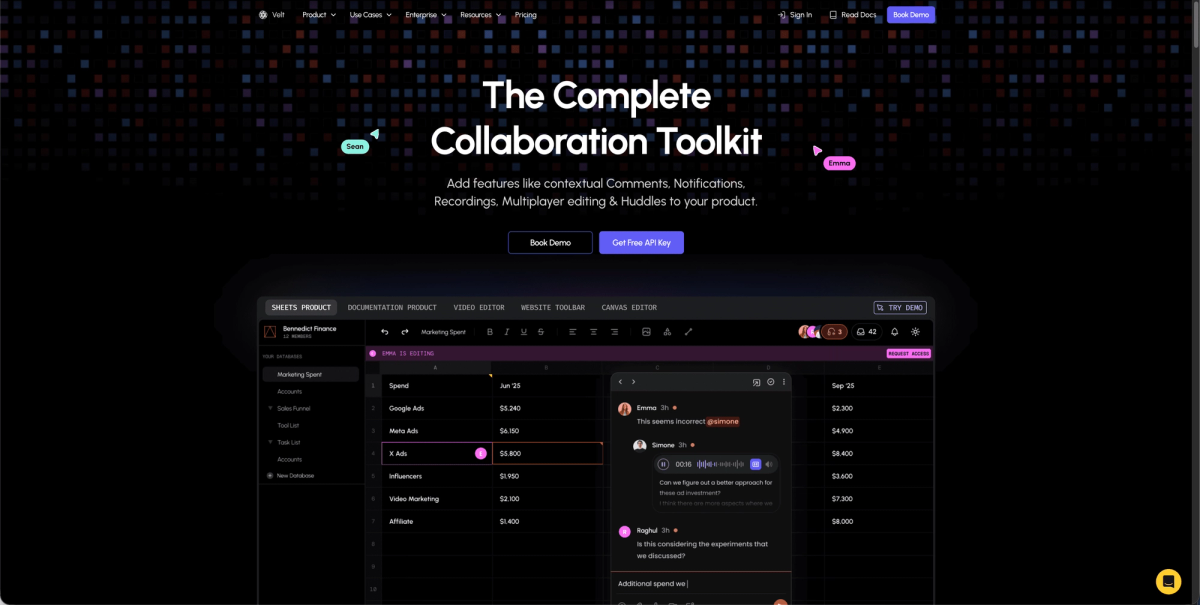
Data visualizations built with any of these libraries work better when teams can discuss insights directly within the dashboard. Velt's SDK adds real-time collaboration to analytics apps and business intelligence tools without requiring users to export screenshots or jump to external feedback channels.
With Velt, users can comment on specific chart elements using DOM-aware positioning that stays anchored to visualizations when layouts shift or windows resize. Team members see live cursors showing where colleagues are analyzing data. And, when someone shares an insight or asks about a trend, in-app notifications alert relevant team members immediately. Context stays attached to the visualization instead of scattering across email threads.
The Velt SDK works with Chart.js, D3.js, Recharts, or any other charting library since it operates at the DOM level. Teams building analytics apps or project management dashboards add these collaboration features in hours instead of spending months building custom commenting infrastructure.
Final Thoughts on Building Data Visualizations
Your JavaScript charts library should match your team's skills and project requirements. Chart.js delivers fast results for common chart types, but D3.js becomes necessary when you need complete control over interactions and layouts. React developers save time with Recharts or Nivo instead of fighting framework integration issues. Performance testing with real data sizes prevents surprises later, and adding collaboration features helps teams discuss insights without switching tools.
FAQ
How do I choose between SVG and Canvas rendering for my charts?
Use Canvas when displaying more than 1,000 data points or when performance matters most, since it draws pixels directly to a bitmap. Switch to SVG for smaller datasets where you need crisp scaling at any zoom level and lower memory usage on mobile devices.
What's the main difference between Chart.js and D3.js?
Chart.js provides pre-built chart types with simple configuration objects, letting you create visualizations quickly with minimal code. D3.js gives you complete control over every visual element but requires understanding SVG coordinate systems and data binding patterns before building basic charts.
When should I consider using a React-specific charting library?
If your app already uses React, libraries like Recharts or Nivo integrate naturally with your component structure, state management, and hooks. For projects using Angular, Vue, or vanilla JavaScript, framework-agnostic options like Chart.js work better since they include official wrappers for multiple frameworks.
Can I add real-time collaboration features to existing chart implementations?
Yes, Velt's SDK works with any charting library since it operates at the DOM level. Teams can add commenting, live cursors, and notifications to dashboards built with Chart.js, D3.js, Recharts, or other visualization tools without rebuilding their charts.