


Zero Adoption Churn: How It Reveals Product-Market Fit for Review Infrastructure (May 2026)
Learn what zero adoption churn reveals about product-market fit for review infrastructure in May 2026. Real retention signals that matter for SaaS growth.

Healthy MRR can mask a broken product. Teams might stay subscribed while your collaboration SDK collects dust in a dormant corner of their codebase. Adoption churn separates real product market fit from surface-level engagement. When review and approval infrastructure gets embedded into daily workflows and zero customers disable it after 90 days, the signal is clear: the feature became critical to how work moves through their organization. That retention curve tells you more about fit than any growth dashboard ever will.
TLDR:
- Zero adoption churn measures if customers kept using your infrastructure after integration, beyond revenue retention.
- Strong product-market fit shows up when retention curves flatten after 90 days instead of decaying.
- Track approval workflow actions per week, organic comment thread growth, and audit trail queries to measure real adoption.
- Infrastructure products with zero churn drive net dollar retention above 100% through seat expansion and feature depth.
- Velt's review infrastructure has 0% adoption churn across 37 production deployments tracked internally, measured by what teams kept in production.
Why Zero Adoption Churn Separates Real Product-Market Fit from Revenue Mirages
Revenue can hide a lot of problems. A company adding 50 new customers a month while quietly losing 40 existing ones looks healthy in the MRR chart, right up until the growth math breaks down. Acquisition momentum can mask a product that never actually sticks. Zero adoption churn cuts through that. It measures whether customers who integrated a feature into their workflow kept using it, without being pushed, reminded, or incentivized. Involuntary behavior. People either build their process around a tool or they don't.
The distinction matters more for infrastructure products. When review infrastructure or an approval workflow gets embedded into a shipping product, removal requires real engineering work. So when teams still churn on adoption despite that friction, the signal is unambiguous: the feature wasn't solving a real problem.
What Zero Adoption Churn Actually Measures (And Why Most Teams Track It Wrong)
Zero adoption churn sounds like a vanity metric until you realize what it's actually counting.
It's not measuring whether users clicked a button or completed an onboarding flow. It's measuring whether teams built workflows around your infrastructure and then had no reason to rip it out.
Most teams track adoption churn by looking at account-level cancellations or seat reductions. That misses the signal entirely.
The real question is whether the review infrastructure became load-bearing inside a product or stayed ornamental.
Here's what to watch instead:
- Whether approval workflows get wired into downstream systems like deployment gates, publish triggers, or compliance sign-off chains. If they do, removal costs exceed any savings from switching.
- Whether comment threads grow organically within a product, meaning reviewers are returning without being prompted. Returned usage without nudges is the clearest sign the infrastructure fits the actual job.
- Whether teams request audit trail exports or access logs, which indicates the review layer is now part of a compliance or accountability process, not simply a UX feature.
When zero adoption churn shows up across all three of these behaviors simultaneously, it tells you something specific about product-market fit: the review infrastructure matched how the team's organization actually moves work forward, not simply how the product team imagined it would.
That distinction matters. Adoption that survives contact with real workflows is qualitatively different from adoption that happens during an evaluation period and quietly fades.
The 40% Rule and Retention Curves: Quantifying Product-Market Fit
When Sean Ellis developed his product-market fit benchmark through surveys of hundreds of early-stage startup users, the 40% rule became the clearest signal the industry had: if fewer than 40% of users say they'd be "very disappointed" without your product, you don't have fit yet. That threshold has held up across thousands of SaaS companies.
Zero adoption churn for review infrastructure tells a similar story, just from a different angle. Users aren't abandoning the workflow after onboarding. That's the retention curve signal Ellis was pointing at, expressed through behavior instead of a survey.
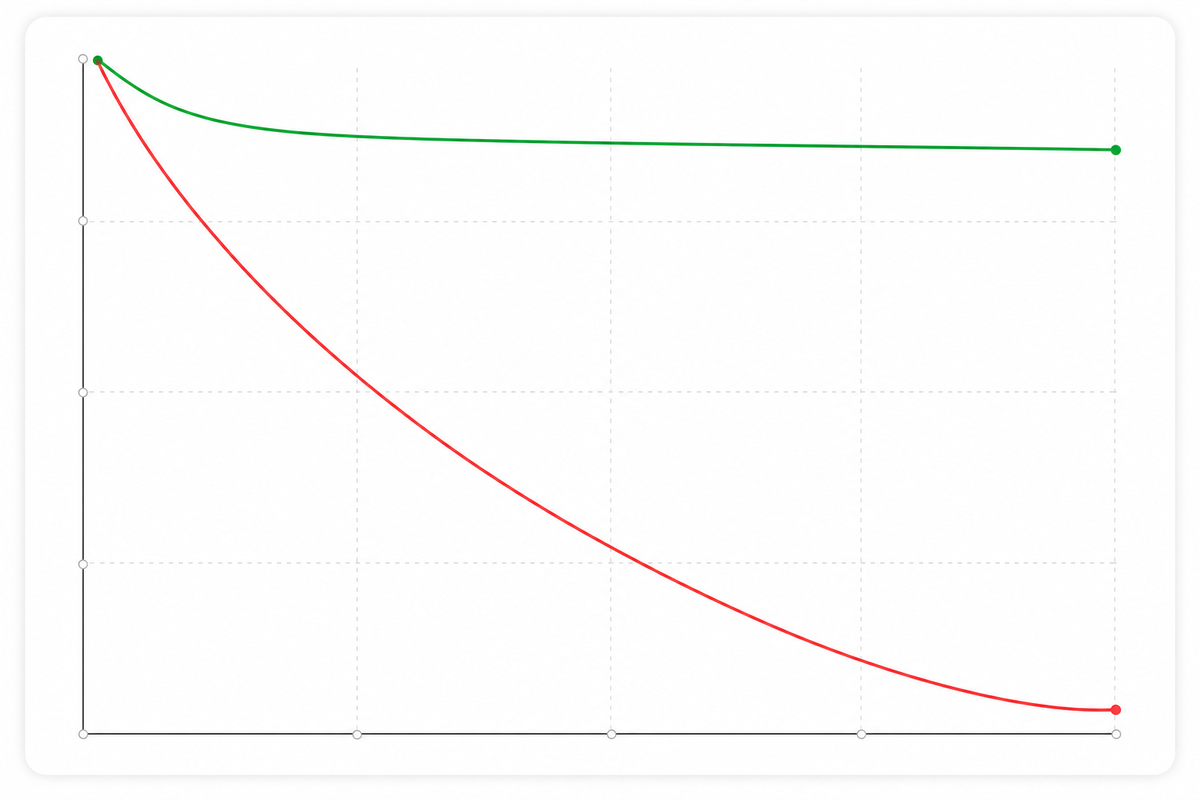
What the Curve Actually Looks Like
Retention curves for sticky infrastructure tools flatten instead of decay. The characteristic shape:
- Early drop-off is minimal because the onboarding friction is low and the workflow value is immediate. Reviewers see anchored comments, approvers see a clear queue, and the loop closes fast.
- After the first few weeks, the curve levels out. Teams have woven approval workflows into their actual process, so leaving would mean rebuilding coordination from scratch.
- Long-term cohorts show near-zero churn. The product isn't simply used; it's load-bearing.
| Retention Signal | Weak PMF | Strong PMF |
|---|---|---|
| Week 1 drop-off | High | Low |
| 90-day curve shape | Continuous decay | Flattens |
| Churn reason | "We stopped using it" | Rarely given |
| Adoption breadth | Single user or team | Spreads org-wide |
When review infrastructure hits that flattened curve, you're looking at genuine fit, not engagement theater.
Net Dollar Retention Above 100%: The Infrastructure Products Threshold

When review infrastructure reaches true product-market fit, the financial signal shows up in net dollar retention. Infrastructure categories that teams genuinely depend on tend to push NDR above 100%, because usage expands as products grow instead of getting ripped out.
The pattern holds for review infrastructure. Teams that ship with Velt's infrastructure don't quietly remove it at renewal. They add seats, expand to new document types, and pull in more reviewers. That expansion behavior is what separates infrastructure from a feature: features get replaced, infrastructure gets extended.
Why NDR Above 100% Signals Genuine Fit
Three behaviors tend to drive expansion in approval workflow adoption:
- Teams start with one document type, then extend review workflows to adjacent content after seeing how much faster approvals move with structured tooling instead of Slack threads.
- Reviewer counts grow organically as products scale, since Velt's presence and notification layer makes it easy to pull in new stakeholders without retraining anyone.
- Compliance and audit requirements deepen over time, making the audit trail component harder to remove without introducing risk, which locks in retention at the account level.
Zero adoption churn feeds directly into this. When no team that integrated Velt has pulled it back out, the NDR floor stays intact, and expansions push the number well past 100%.
Customer Acquisition Cost (CAC) Payback Period: When Adoption Speed Determines Capital Performance
When review infrastructure gets adopted quickly, the math on customer acquisition changes. CAC payback period, the time it takes to recoup what you spent acquiring a customer, compresses when users activate fast and stick around.
The mechanics are straightforward. If acquiring a customer costs $8,000 and their monthly contract value is $800, you need 10 months of clean retention just to break even on the acquisition cost. That's before accounting for support overhead during onboarding. Every week a team spends waiting to see value from approval workflows is a week the payback clock ticks without a revenue offset. A two-week activation delay on a $400/month account adds weeks of dead cost with no LTV contribution.
Slow activation stretches payback further when it matches with early churn. Teams that never fully activate an approval workflow are the same teams most likely to quietly drop the integration at the next renewal. The payback clock doesn't simply run longer. It stops before it completes.
Zero adoption churn flips both sides of the equation. Teams that activate in days start contributing contract value immediately, shortening the payback window on the revenue side. And because they don't churn, the LTV that backs the acquisition cost keeps compounding. A customer who activates in three days and stays for three years looks very different on a unit economics spreadsheet than one who activates in six weeks and leaves after one renewal cycle. Velt's review infrastructure is designed to close that first activation loop in hours, not weeks: reviewers see anchored comments on day one, approvers see a queue the same day, and the workflow closes without any back-and-forth about where feedback lives.
Why Speed of Value Matters to Investors
For B2B SaaS, payback periods under 12 months are generally considered healthy by most investor benchmarks, including those tracked by OpenView Partners and SaaS Capital. Review infrastructure that delivers first value in hours instead of weeks can push payback below that threshold even at higher ACVs.
| Activation Speed | Retention Signal | CAC Payback Impact |
|---|---|---|
| Days | High (zero churn observed) | Payback compresses under 12 months |
| Weeks | Medium (some early churn) | Payback stretches to 12-18 months |
| Months | Low (activation failure likely) | Payback exceeds 18 months or never |
When customers self-report that Velt's review and approval infrastructure required no dedicated integration sprint, with reviewers live within a day and no training sessions needed, that speed shows up directly in capital performance metrics. Fast activation plus zero adoption churn is the proof investors want to see before scaling acquisition budgets.
Why Infrastructure Products Face a Higher Adoption Proof Burden
Infrastructure products get looked at differently than feature products. When a team adopts a new UI component or analytics tool, failure is recoverable: swap it out, move on. When a team adopts review infrastructure, comments, approval workflows, presence, notifications, audit trails, and recording get woven into production code, user-facing workflows, and compliance documentation. Ripping it out costs months.
That switching cost raises the evaluation bar. Buyers want proof that other teams adopted it and stayed. not simply deployed it, but built on top of it, shipped it to users, and never looked back.
This is where approval workflow customer proof carries weight that feature-level demos can't. A demo shows what the SDK does. Adoption data shows what engineers decided to keep.
Why Zero Churn Is a Stronger Signal Than High Retention
Retention numbers can be padded by contracts, inertia, or switching costs alone. Zero adoption churn is harder to explain away. It means teams looked at the integration, shipped it, and found no reason to remove it after the fact. For review infrastructure, that signal matters because the failure modes are so visible. Broken comment threads surface in user sessions. Approval workflows that don't fit teams get abandoned. Audit trails that miss events create compliance gaps. None of these failures stay quiet.
When no team has churned off Velt's review infrastructure after integrating it, that's a data point about product-market fit that no marketing claim can replicate.
How to Measure Zero Adoption Churn in Practice
The distinction between activation and adoption is where most measurement breaks down. Activation is a one-time event: the first comment thread placed, the first approval assigned, the first audit log entry written. Adoption is the pattern that follows, repeated and unprompted, after that initial moment passes.
To measure zero adoption churn, build cohorts around activation milestones and track usage signals at 30, 60, and 90 days. The signals worth watching:
- Approval workflow actions per week (not seat logins, which prove presence without proving use)
- Comment threads started by users outside the original integration team, indicating the review layer is spreading organically
- Audit trail queries, which signal the infrastructure is now part of a real compliance or accountability process
A cohort that hits all three at 90 days has adopted. One that drops to zero across all signals by day 60 has churned on adoption, regardless of whether the account is still active.
Setting Frequency Thresholds
Thresholds depend on your product's review cadence. A content production tool might fire approval workflows daily; a financial planning tool might run weekly or monthly cycles. Set your threshold relative to expected workflow frequency, not absolute session counts.
For most review infrastructure deployments, a reasonable baseline is at least one approval workflow action per expected review cycle, with comment thread volume from non-integration-team users growing week over week through the first 90 days.
The Zero-Churn Cohort as Your Ideal Customer Profile Signal
Zero-churn accounts are more than a retention story. They're a map.
Segment your zero-churn cohort by vertical, team size, and use case, and patterns will bubble up that your pipeline data can't surface alone. A content operations team at a 200-person SaaS company might show consistently deeper 90-day engagement than an enterprise account three times its size. That's your ideal customer profile signal, and it's coming from behavior, not from what a prospect told you on a discovery call.
What the Cohort Actually Tells You
When you look at zero-churn accounts for review infrastructure adoption, a few things tend to be true across the board:
- Teams where review cycles are a daily bottleneck, not an occasional workflow, attach to approval workflow features within the first week and never leave. The pain was real before they signed up.
- Smaller, focused teams often show higher feature depth than larger accounts because fewer stakeholders means faster internal alignment around the tool.
- Accounts that integrated Velt into an existing production workflow, instead of a side project or prototype, almost never churn. The switching cost becomes real, and the value compounds.
The zero-churn cohort isn't simply telling you who stayed. It's telling you who had the right problem to begin with. That's the customer proof your approval workflow positioning needs to be built around.
What Velt's Zero Adoption Churn Reveals About Review Infrastructure Product-Market Fit
Across 37 production deployments tracked internally, not one team that integrated Velt's comments and approval workflows into their review process has pulled it back out. Zero adoption churn, measured the hard way: by watching what engineers actually kept in production after the evaluation period ended.
That number is the clearest signal we have about product-market fit for review and approval infrastructure. When teams embed contextual review directly into the product where work happens, the alternative of routing feedback through Slack threads and email chains stops being acceptable. The workflow change holds because the old way becomes visibly worse by comparison. There's no going back to unanchored threads and lost approvals once reviewers have worked inside a structured layer.
Thirty-seven deployments tracked internally is a small number. But 0% churn across all of them is the kind of proof that no retention dashboard can manufacture.
Final Thoughts on What Zero Churn Actually Tells You About Product Fit
Adoption churn separates infrastructure that becomes load-bearing from features teams look at and forget. When review workflows get embedded into shipping processes and never removed, you're watching genuine product-market fit play out in production. The financial metrics follow: flattened retention curves, net dollar retention above 100%, and CAC payback windows that compress instead of stretch. That's the proof point that matters to scaling acquisition spend. If you need review and approval infrastructure that teams actually keep, book a demo to see what 0% adoption churn looks like across 37 production deployments.
FAQ
What's the best way to prove product-market fit for review infrastructure?
Zero adoption churn is the clearest signal. It measures whether teams that integrated review workflows kept using them without prompts or incentives, which shows the infrastructure solved a real problem and became load-bearing in production.
Review infrastructure zero adoption churn vs revenue retention?
Zero adoption churn tracks whether teams keep using integrated features in their actual workflows, while revenue retention can mask adoption failures through contracts or inertia. Adoption churn tells you if the product actually fits how teams work, not simply whether they're still paying.
Can zero adoption churn predict expansion revenue?
Yes. When teams integrate review and approval infrastructure and never remove it, they typically add seats, expand to new document types, and pull in more reviewers as products grow. That expansion behavior pushes net dollar retention above 100% and shortens CAC payback periods.
How do I measure zero adoption churn in practice?
Build cohorts around activation milestones and track three signals at 30, 60, and 90 days: approval workflow actions per week, comment threads started by users outside the integration team, and audit trail queries. A cohort hitting all three at 90 days has adopted, not simply activated.
When should I use my zero-churn cohort data?
Segment zero-churn accounts by vertical, team size, and use case to find your ideal customer profile. Teams where review cycles are daily bottlenecks and who integrated into production workflows almost never churn, and that pattern tells you who had the right problem before they signed up.Infrastructure products get looked at differently